Feb. 19, 2024
Is Princeton NJ a Good Place to Live? An In-depth Look
As a top Princeton real estate agent with my office on Nassau Street, who has lived in the Princeton area for over 15 years, I've experienced firsthand what it's like to call this place home. Not only have I navigated the local real estate market professionally, but I've also immersed myself in the community, sending my children through the Princeton Public Schools. From this unique vantage point, I'm excited to share with you why Princeton NJ is more than just a good place to live—it's a vibrant, nurturing, and dynamic community that many are proud to call home.

Introduction to Princeton's Living Conditions
There's more to Princeton than just Princeton University, and thankfully, you don't have to be a member of MENSA to live here! All jokes aside, Princeton offers the charm of tree-lined neighborhoods and a sense of community among its approximately 30,000 residents. Its location in central New Jersey, coupled with an efficient transit network, puts it a quick train ride away from both New York City and Philadelphia. This unique blend of small-town charm and accessibility to major cities makes Princeton's living conditions exceptionally appealing.
A Brief Overview of Princeton's Historical Significance
Princeton is not just known for its ivy-covered buildings; it's a town steeped in rich history. From pivotal Revolutionary War battles to housing some of the most influential figures in American history, Princeton's past is a tapestry of events that have shaped not only the town but the nation. This historical significance adds a layer of depth to the community, making it not just a place to live but a place to be part of a living history.
The Dual Nature of Princeton as a College Town
Princeton's identity is undeniably intertwined with that of Princeton University, one of the oldest universities in the United States. This relationship bestows the town with a dual nature, combining the vibrancy of college life with the tranquility of a residential community. The university's rich history and its role in American history contribute significantly to the town's character. At the same time, the presence of over 8,000 students brings a youthful energy that permeates local establishments and community events, enriching the college town experience for everyone.
The Costs Associated with Living in Princeton
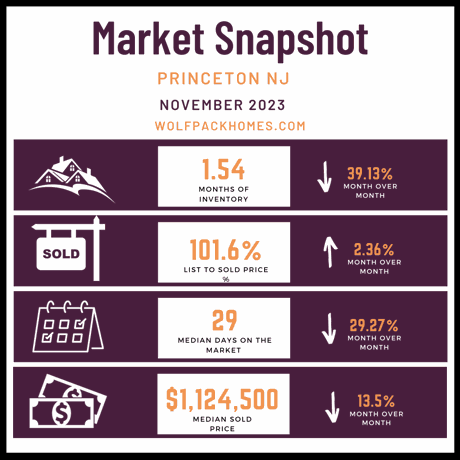
Living in Princeton, one of the best places to live in New Jersey, comes with its costs. The average price of homes reflects the high demand for the quality of life here. Check out the most recent Princeton, NJ market report here for the latest homes sale prices. While the costs might be higher than the national average, Princeton residents enjoy safe neighborhoods, excellent schools, lush parks, and proximity to major cities. Moreover, the strong sense of community, access to amenities, and low crime rates make the financial investment worth considering for many.
Housing and Real Estate Insights
As a top real estate agent in Princeton, I've seen firsthand the evolution of the housing market. The demand for homes in Princeton reflects not just the desire for a place to live but for a place to thrive. The wide range of architectural styles and community layouts offers something for everyone, from historic homes in the Western Section to modern apartments.
Pros
Living in Princeton is characterized by access to top-tier education, from public schools like Princeton High School, renowned for its high standards and achievement, to Ivy League Princeton University. The town boasts lush parks, extensive collections in local libraries and museums, and a vibrant community life. These features make it an ideal place for families, academics, and young professionals alike, seeking a balanced and enriching lifestyle.
Cons
However, the high quality of life in Princeton does come at a cost. The real estate market is competitive, with prices significantly above the national average. For some, this can make the dream of living in Princeton more challenging to achieve. Furthermore, the high property taxes reflect the premium services and amenities available, which might not be feasible for everyone's budget.
Everyday Living Expenses
Living in Princeton, I've found that the everyday expenses offer a unique blend of value and quality of life. With its tree-lined neighborhoods, Princeton combines the charm of a close-knit community with the convenience of a central New Jersey location. This means that while you might spend a bit more on groceries and dining out compared to other towns, you're also investing in a lifestyle that's hard to find elsewhere. The accessibility to New York City and Philadelphia via a quick train ride adds tremendous value, making it possible to enjoy the cultural and entertainment options of major cities without the higher cost of urban living.
Quality of Education in and Around Princeton
As a parent whose children have gone through the Princeton Public Schools, I can personally attest to the high quality of education here. Downtown Princeton itself is a hub of academic excellence, surrounded by some of the best schools in the state. The commitment to education is palpable, from public to private institutions, ensuring that every child receives a top-notch learning experience. This environment not only fosters academic growth but also prepares students for successful futures, making Princeton an ideal place for families prioritizing education.
Top Public Schools Serving Princeton
Princeton High School, with its rating of 3 out of 5, and the other public schools in Princeton stand as testaments to the town's commitment to education. These schools, including the esteemed Princeton High School, provide a robust learning environment. The ratings, such as schoolrating 4 for some, reflect the community's trust and satisfaction with the educational standards upheld here. It's a privilege to have my children attend schools that are so highly regarded.
Princeton High School
Princeton High School, with its rating of 3 out of 5 and being part of the distinguished public schools in Princeton, has been a cornerstone of my children's education. The school's comprehensive curriculum and dedicated faculty have played a pivotal role in their academic and personal development. It's a school where excellence is not just pursued but is a tradition.
Littlebrook Elementary School
Littlebrook Elementary School, nestled in the heart of Princeton, NJ, continues to shine as a beacon of educational excellence. In its latest ranking, it has upheld its reputation by being recognized as one of the top elementary school sin New Jersey, reflecting its commitment to fostering an enriching and supportive learning environment for its students. See all homes for sale in the Littlebrook area of Princeton, NJ here.
Top Private Schools Near Princeton
Near Princeton, prestigious private schools such as The Lawrenceville School, Princeton Day School, and The Hun School, all boasting a schoolrating 4, offer unparalleled educational opportunities. These institutions are not just schools; they are gateways to higher learning and future success. Located conveniently in and around Princeton, they provide easy access for families living in Princeton or surrounding towns.
The Lawrenceville School
The Lawrenceville School, with its schoolrating 4, is a beacon of excellence in private education. Its historic campus and forward-thinking approach to learning make it a top choice for families seeking an exceptional educational experience for their children.
Princeton Day School
Princeton Day School, also with a schoolrating 4, stands out for its commitment to fostering intellectual curiosity and academic rigor. Its vibrant community and holistic approach to education ensure that students are well-prepared for the challenges of the future.
The Hun School
The Hun School, with its expansive campus and schoolrating 4, offers a nurturing yet challenging environment for students to grow both academically and personally. Many families choose to send their children to this school to benefit from the individual attention and diverse programs that cater to their unique interests and talents.
The Community and Lifestyle
Living in Princeton is a joy for individuals and families. The community here is vibrant, welcoming, and rich with cultural and recreational activities. From the arts and athletics to the various cultural and affinity groups, there's always something happening. The emphasis on health, wellness, and serving the public good resonates with most resident's personal values, making Princeton not just a place to live, but a place to grow and always be learning.
Crime & Safety in Princeton
In my 15 years living here, I've found Princeton to be a relatively safe town. The focus on community safety is evident, and while no place is immune from crime, the instances of violent crime are notably low. This peace of mind has been invaluable, especially as a parent.
Local Amenities and Public Services
Princeton's local amenities and public services are second to none. From the excellent public schools, including Princeton High School, to the unique dining experiences at places like Jammin Crepes and Contes Pizzeria, the town caters to a wide range of needs and preferences. The commitment to providing high-quality services and amenities contributes significantly to the quality of life here.
Public Transportation Accessibility
The accessibility of public transportation in Princeton has been a game-changer for me, especially with the demands of a busy real estate career. The reliable transit network makes it easy to navigate the town and beyond, enhancing our connectivity to major cities and job hubs.
Healthcare Facilities
The healthcare facilities in Princeton are top-notch, offering comprehensive care and peace of mind for families. Knowing that high-quality medical services are readily available has been a great comfort to me and my family over the years.
Employment Opportunities
Princeton's job market is vibrant, with employment opportunities ranging from academic positions at Princeton University to roles in multinational companies. This diversity in employment options has been crucial for me, allowing me to thrive professionally without compromising on the quality of personal life that Princeton offers.
Job Market Analysis
Living in Princeton, I've seen firsthand how the job market flourishes, primarily because of Princeton University, which isn't just for professors. There are numerous administrative roles, making it a pivotal employer. Beyond academia, Princeton boasts a wealth of opportunities in multinational companies and small businesses alike. From retail to health & wellness, the diversity is vast. Notably, giants like Johnson & Johnson, BlackRock, and Bristol Myers Squibb also offer promising careers. This variety ensures that whether you're just starting out or looking for something new, Princeton's job market is adaptable and vibrant.
Proximity to Major Cities and Job Hubs
One of the benefits of living in Princeton is its strategic location. While it maintains a charming small-town vibe, it's conveniently close to major job hubs. New York City and Philadelphia are easily accessible, providing even more employment opportunities across various industries. This proximity blends the best of both worlds — living in a peaceful, historic town with access to the hustle and bustle of city life and its plethora of job options. It's perfect for professionals who crave a balanced lifestyle.
Recreational and Cultural Aspects
Princeton isn't just about work; it's a town that celebrates life. Between its rich history, vibrant arts scene, and outdoor adventures, there's always something to do. As a real estate agent here, I've explored every corner and experienced the diverse cultural tapestry that makes this place unique. Whether you're an art aficionado, history buff, or nature lover, Princeton's recreational and cultural offerings cater to all interests, making it a wonderful place to call home.
Things to Do and Places to Explore
Exploring Princeton offers a blend of historical charm and natural beauty. The Princeton University Art Museum is a treasure trove of art and culture, while the surrounding Mountain Lakes and the D&R Canal State Park offer serene escapes into nature. The Arts Council and McCarter Theatre Center are hubs of creativity, hosting a variety of shows and workshops. For history enthusiasts, the Morven Museum and the battlefields of Princeton offer a glimpse into America's past, making every weekend an opportunity for a new adventure.
Local Favorites and Cuisine Scene
Princeton's cuisine scene is as rich as its history. From cozy cafes to gourmet restaurants, there's a flavor for every palate. The town's connection to the Revolutionary War adds a historical flavor to dining, with some eateries even offering dishes inspired by the era. The Princeton Battle Monument and sites related to the Battle of Princeton serve not just as reminders of our nation's history but also as unique backdrops for a culinary journey.
Events, Entertainment, and Arts
Living in Princeton opens up a world of cultural and entertainment opportunities that are hard to find elsewhere. For art enthusiasts, the McCarter Theatre Center is a gem, having earned a Tony Award for outstanding regional theater, and it's within easy walking distance for anyone wanting to catch a show. Just a short stroll away, the Morven Museum and Garden invites visitors to explore over 200 years of history through its remarkable collection of fine and decorative arts. For those who enjoy a good tune or a captivating film, local venues host live music across various genres, and the Princeton Garden Theatre offers a mix of the latest blockbuster movies, timeless Hollywood classics, and intriguing foreign films. This vibrant scene ensures there's always something going on to keep you entertained.
Making the Move to Princeton
If your company is relocating to Princeton, you're stepping into a welcoming business community bustling with opportunities for growth and networking. Princeton's thriving downtown, complemented by a vibrant business atmosphere, is eager to welcome new faces. From customized move plans that cater specifically to your business needs to a seamless transition ensured by our experienced team, moving your office to Princeton promises a fresh start in a dynamic environment. The town's strong support for new businesses makes it an ideal place to relocate and thrive.
Pros and Cons of Relocation
Considering moving to Princeton brings to light various advantages and disadvantages. The town boasts a wealth of amenities, including restaurants, coffee shops, and grocery stores, all conveniently located within walking distance. The area scores high in terms of commute convenience, thanks to excellent public transit and shorter-than-average work commute times. Moreover, the crime rate is significantly lower than the national average, ensuring a safe living environment. The local job market is robust, reflected in higher-than-average median household income and lower unemployment rates. However, these benefits come with a high cost of living, which is an important factor to consider when thinking about relocating to Princeton.
Pros
One of the major perks of living in Princeton is the accessibility to a variety of amenities. Everything from charming coffee shops to fully-stocked grocery stores is just a short walk away. The area's excellent public transportation system and favorable commute times make getting around a breeze. Princeton’s low crime rates far below the national average contribute to its appeal as a safe place to live. Additionally, the strong job market, evidenced by high median household income and low unemployment rates, offers plenty of employment opportunities. The combination of these factors creates a highly desirable living environment for residents.
Cons
The primary drawback of relocating to Princeton is the high cost of living, which may be a significant consideration for some families and individuals.
Final Thoughts for Potential Movers
As a top real estate agent in Downtown Princeton NJ, and having lived in the Princeton area for over 15 years, I've seen many families thrive here, including my own. Moving to Princeton means embracing a lifestyle that combines the charm of a small town with the sophistication of a city. Whether you're eyeing single-family homes, luxury homes, or something in between, Princeton offers a variety of housing options to suit different preferences and budgets. The exquisite food options, beautiful parks, and the overall inviting atmosphere make it a charming town to call home. If you're considering making the move, I'm here to guide you through every step, ensuring you find a place that feels like home.
A Conclusion on Life in Princeton NJ
Living in Princeton NJ has been a rewarding experience for my family and me. It stands out as one of the best places to live in New Jersey, not just for its prestigious university but for the quality of life it offers. The town provides a perfect blend of suburban comfort with easy access to major cities like NYC and Philadelphia, making it ideal for those who appreciate a serene environment without losing touch with urban life. Princeton's vibrant community, rich history, and diverse cultural scene contribute to its unique charm, making it more than just a college town.
Weighing the Pros and Cons: Is Princeton NJ the Right Place for You?
Deciding to live in Princeton requires considering both its advantages and limitations. The town's low crime rates, high-quality education system, and the abundance of amenities like coffee shops, grocery stores, and parks, positioned conveniently around, provide a comfortable and secure living environment. Princeton's housing market, while offering beautiful homes and lush green surroundings, comes with a high cost of living. The weather, with its crisp fall and spring and the picturesque snowy winters, might not be for everyone. However, if you value a dense suburban feel, highly rated schools for your children, and a community that boasts a rich history and cultural depth, Princeton might just be the perfect place for you. As someone who has lived and worked here for years, I can attest to the fulfilling lifestyle Princeton offers, making it a worthy place to consider calling home.
.jpg)


.jpg)
.png)