Moving To & Living In Princeton NJ:
The Ultimate Guide to the Best Neighborhoods and Local Attractions
Are you considering making a move to the beautiful city of Princeton, New Jersey? We’ve put together a comprehensive guide to help you make the most of living in Princeton. Situated in central New Jersey, Princeton boasts a vibrant community of approximately 30,000 residents who live in tree-lined neighborhoods. It's hard not to fall in love with this charming town, known for its impressive Ivy League University and a wealth of activities for the whole family. In this guide, we'll cover everything you need to know about living in Princeton, from real estate to top schools and the best places for shopping, dining, and outdoor recreation. Living in Princeton, here we come!
Living in Princeton, NJ
Princeton has a charming and cozy atmosphere that makes it the perfect place to call home. The town is a bustling hub for local businesses, community events, and vibrant cultural offerings. Princeton offers a wide range of activities for outdoor enthusiasts, including hiking trails and picturesque parks for all ages to enjoy.
Princeton has a diverse population of approximately 30,000 people. It’s home to a variety of age groups, including young families, college students, retirees, and everything in between. Princeton is of course known for its thriving academic community, with Princeton University serving as a major employer.
The climate in Princeton is relatively mild, with warm summers and cold winters. Living in Princeton, you’ll experience an average of 203 sunny days per year—appealing to many! It only experiences occasional snowfall during the winter months, which adds to the area's overall appeal and charm.
Princeton is known for its rich history, elegant architecture, and cultural atmosphere. During the summer months, the town hosts a wide range of outdoor events such as the annual Health and Wellness Fair. It’s also known for its exceptional dining experiences, including the renowned Witherspoon Grill.
Overall, Princeton offers a high quality of life, with excellent schools, abundant job opportunities, cultural diversity, and a strong sense of community. It’s no wonder Princeton is ranked as one of the best places to live in the United States.
Location and Geography
If you're considering living in Princeton, New Jersey, it's important to understand the location and geography of the area. Princeton is located in Mercer County, which is in the central part of the state. It's about an hour's drive from both New York City and Philadelphia, making it a convenient location for those who need to commute to either city for work or leisure.
Geographical Features of Princeton
Princeton is situated on the eastern edge of the Piedmont Plateau, which is a region of rolling hills and forests. The Millstone River flows through the town, and there are several parks and nature preserves in the area, including the Delaware and Raritan Canal State Park and the Princeton Battlefield State Park. The town itself is relatively small, with a total area of just over 18 square miles.
Climate of Princeton
The climate in Princeton is classified as humid subtropical, which means that it has hot summers and cold winters. The average high temperature in the summer months is around 85 degrees Fahrenheit, while the average low temperature in the winter months is around 20 degrees Fahrenheit. The area receives around 45 inches of precipitation per year, with most of it falling in the form of rain during the summer months.
Overall, the location and geography of Princeton make it an attractive place to live for those who enjoy the outdoors and want to be close to major cities. The rolling hills and forests provide plenty of opportunities for hiking and other outdoor activities, while the proximity to New York City and Philadelphia means that you can easily access all of the cultural and entertainment options that those cities have to offer.
Cost of Living in Princeton
Princeton is known for its high cost of living, but it's important to note that the cost of living can vary depending on the neighborhood and housing option you choose. According to Niche, the cost of living in Princeton is 82% higher than the national average. Here are some of the costs you can expect to pay:
- Housing: The median home value in Princeton is $772,000, and the median rent is $2,200 per month.
- Utilities: The average monthly utility bill in Princeton is $150.
- Transportation: The average commute time in Princeton is 25 minutes, and most residents drive to work. Gas prices in Princeton are slightly higher than the national average.
- Food: Dining out in Princeton can be expensive, with the average meal costing around $30+ per person. However, there are also plenty of affordable dining options available, especially for the University students on Nassau Street.
Education in Princeton, NJ
If educational options are on your list of requirements when considering Princeton, NJ homes for sale, then you’re in luck as the local educational options are sure to check off all the boxes.
There is of course Princeton University, a world-class institution known for its comprehensive approach to learning that combines the best of research universities and liberal arts colleges. But that's not all Princeton has to offer. Living in Princeton, students have access to some of the best-ranked quality education beginning in early childhood and carrying right through to the highest level of schooling.
Princeton Public Schools is one of the top-rated school districts in the state with a rating of A+ according to Niche.com. The district is known for its exceptional education and resources. With six schools and approximately 3,500 students enrolled, this district provides a wide range of educational opportunities for students of all ages.
Whether your preference is private or public, traditional or a more innovative approach to education, there are plenty of great educational options available in Princeton, NJ. Let's take a closer look at some of the best Niche A+ rated schools this amazing city has to offer:
Top Public Schools in Princeton NJ:
- Littlebrook Elementary School (Pre K-5th grade)
- Johnson Park Elementary School (Pre K-5th grade)
- Princeton Charter School (K-8th grade)
- J. Witherspoon Middle School (6-8th grades)
- Princeton High School (9-12th grades)
Private Schools in Princeton NJ:
- Princeton Day School (Pre K-12th grade)
- Hun School (6-12th grades) boarding optional
- Stuart Country Day School (Pre K-12th grade) Catholic All-girls
- The Waldorf School of Princeton (Pre K-8th grade)
- Princeton Montessori School (Pre K-8th grade)
- St. Paul School of Princeton (Pre K-8th grade)
- Princeton Friends School (Pre K-8th grade)
- Princeton Junior School (Pre K-8th grade)
- and more...
We’ve only mentioned a small number of the available schools Princeton has to offer. With so many incredible options for outstanding education in Princeton, NJ, choices abound.
Things to Do in Princeton, NJ
Princeton offers a captivating blend of upscale living and small-town charm. Every year, people from all over are drawn to the area's picturesque scenery, top-notch education, and world-renowned cultural landmarks. With so much to explore, it's no wonder the town is a hit with locals and visitors alike.
From serene parks and lush gardens to eclectic shopping destinations and an explosive dining scene, there's so much to do living in Princeton. Whether you're a nature lover, foodie, shopaholic, or just in search of some inspiration, Princeton has it. Ready to explore? Let's take a closer look at some of the top destinations and attractions in the area and what awaits anyone moving to Princeton apart from the exceptional Princeton, NJ homes for sale.
Parks & Recreation
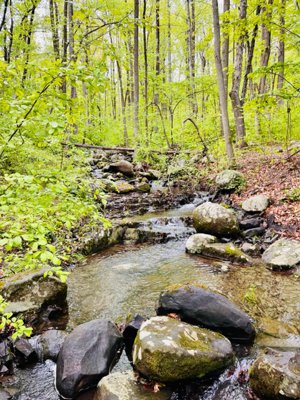
Part of the great appeal of moving to Princeton is the city’s diverse parks and recreation options. If you're looking for fun ways to be active and enjoy the outdoors, living in Princeton will not disappoint.
Take a stroll around Mountain Lakes, including the picturesque Pettoranello Gardens. Explore the history of the Revolutionary War at Princeton Battlefield State Park. Enjoy a peaceful walk in the Western Section of Marquand Park, or take a memorable picture by the Fountain on Princeton University's campus.
If sports are your thing, play a game of soccer at Smoyer Park or Farmview Fields. There are plenty of options available, ensuring that every person can enjoy their leisure or activity time as they desire.
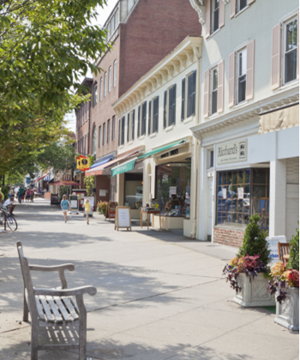
Shop Til You Drop
Princeton, NJ is a shopping haven with various options for shopping enthusiasts. From local boutiques, malls, and outdoor shopping centers, you're sure to find everything you need and more. Be sure to visit these top shopping destinations to unleash your inner shopaholic:
- Princeton Shopping Center: The Princeton Shopping Center has been a community gathering place for over 60 years. The fifty-business mall features plenty of local stores, making it an ideal shopping spot for anyone looking to buy unique home decor items, clothes, gifts, and much more.
- Palmer Square: Located in downtown Princeton, Palmer Square is a must-visit destination for anyone looking for great shopping options. You will find J Crew, Hamilton Jewelers, Ralph Lauren, Boutique Clothing Stores, as well as Arhaus Studio Home Furnishing Showroom and more. Have a meal at Mediterra, Maman French Cafe, or have THE BEST grilled cheese at Olsson's Fine Foods.
- MarketFair: A sophisticated shopping destination that offers a diverse range of product categories from clothing, shoes, and jewelry to home decor, Barnes & Noble, relaxed dining options, and a movie theater with multiple screens.
- Princeton Farmers Market: Princeton Farmers Market is a great place for fresh, sustainably-sourced products from local farmers and producers. With a variety of homemade goods, fresh fruits and vegetables, breads, cheeses, and more, the Princeton Farmers Market is the perfect place to find quality ingredients to tantalize your taste buds.
Arts & Entertainment in Princeton
When it comes to arts and entertainment the Princeton-Mercer region offers a vibrant arts scene, with plenty of galleries and theaters to explore.
Check out the McCarter Theatre Center for an unforgettable night of theater, or visit Morven Museum & Garden for a unique cultural experience.
Looking for something a little more low-key? Art@Bainbridge offers art exhibits and workshops in Palmer Square, or catch a movie at the Princeton Garden Theatre, across the street from Princeton U. No matter your preference, you'll love exploring the Princeton arts scene.
Drinking & Dining in Princeton
Princeton, NJ offers a bountiful drinking and dining scene. You can choose from a wide range of options such as fine dining restaurants, casual eateries, outdoor cafes, beer gardens, and cocktail bars. The area features a diverse array of international cuisine options including Italian, Asian, French, and Mediterranean.
The vibrant nightlife scene includes everything from sports bars to wine bars and nightclubs. Overall, Princeton offers a culinary experience to suit every budget and taste. We've listed below just a few of the many choices you'll have for enjoying a great night out when living in Princeton, NJ.
- Blue Point Grill
- The Alchemist & Barrister
- Triumph Brewing (moving to the old Post Office building in Palmer Square)
- Agricola
- Mediterra (Palmer square)
- The Meetinghouse
- The Dinky
- Planted Plate (vegan)
- Sakura Express
Princeton, NJ Real Estate
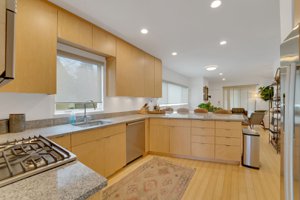
Whether you're moving to Princeton or relocating within Princeton, you need to research Princeton, NJ homes for sale. You'll be happy to know there's no shortage of diverse options. You can find a mix of new properties and charming older homes, ranging from condos to single-family homes, all with unique characters and features to fit any lifestyle or preferences.
The median listing home price in Princeton is currently sitting around $750,000, but prices can vary depending on the size, location, and condition of the property.
The Princeton real estate market attracts a diverse group of buyers, including young professionals, families, and retirees. Whether you're looking for a top-rated school district, close proximity to the city, or a peaceful suburban lifestyle, Princeton has a neighborhood for you.
Here are some of the most popular neighborhoods and housing options in Princeton:
- Western Section: This neighborhood features a mix of historic homes and townhomes, making it a popular choice for families and young professionals.
- Washington Oaks: This community offers luxury townhouses and single-family homes with easy access to downtown Princeton, located between downtown Princeton and Lawrenceville, NJ.
- Queenston Commons: This townhouse community is located in downtown Princeton and offers a range of amenities, including a pool and tennis courts. Very close to Whole Earth Natural Foods as well as Princeton Shopping Center.
- Downtown Princeton: If you want to be in the heart of the action, downtown Princeton is the place to be. You'll find a mix of historic homes, apartments, and condos within walking distance of shops, restaurants, and entertainment.
- Palmer Square: This upscale shopping and dining destination also offers luxury apartments and townhouses.
- Ettl Farm: This community of luxury single-family homes in a private setting is located just outside of downtown Princeton.
- Riverside: This neighborhood is close to Princeton University, features a mix of historic homes as well as homes built in the 1960's and 1970's, with easy access to the Delaware and Raritan Canal towpath for outdoor recreation, close to Lake Carnegie.
- Littlebrook: This family-friendly neighborhood features a mix of single-family homes and some townhouses, with easy access to schools and parks.
- Princeton North: This community of single-family homes and townhouses is located just north of downtown Princeton up Witherspoon Street in walking distance to Princeton Middle School and High School.
- Princeton Ridge: This neighborhood features a mix of single-family homes and townhouses, with easy access to shopping and dining.
With its ideal blend of small-town charm and big-city amenities, Princeton, NJ is an exceptional place to put down roots. Whether you're seeking quality education, cultural enrichment, or simply a thriving and tight-knit community, Princeton will provide. Along with an exceptional range of dining, shopping, and entertainment options, the area also features a diverse range of Princeton, NJ homes for sale to suit every preference and budget. The Princeton real estate market is dynamic and offers a number of housing options, from grand estates and historic homes to modern townhouses and apartments. What are you waiting for? Your dream home in the perfect neighborhood awaits.